

Meeting statistics: how much time do employees spend in meetings? Six studies, one range
Steffen Rosenögger, Founder of CapmePublished November 12, 2026
Six academic studies put meetings at 11% to 38% of working time. Why Capme uses 21.7%, and both calculators worked through.
In short
- Six studies measure 11% to 38% of working time in meetings; the middle half lies between 13.5% and 21.7%.
- Capme uses 21.7%, about 1.7 hours a day, because most samples are developers and staff, and leads sit in far more meetings.
- Method and role explain the spread, so measure your own team by role.
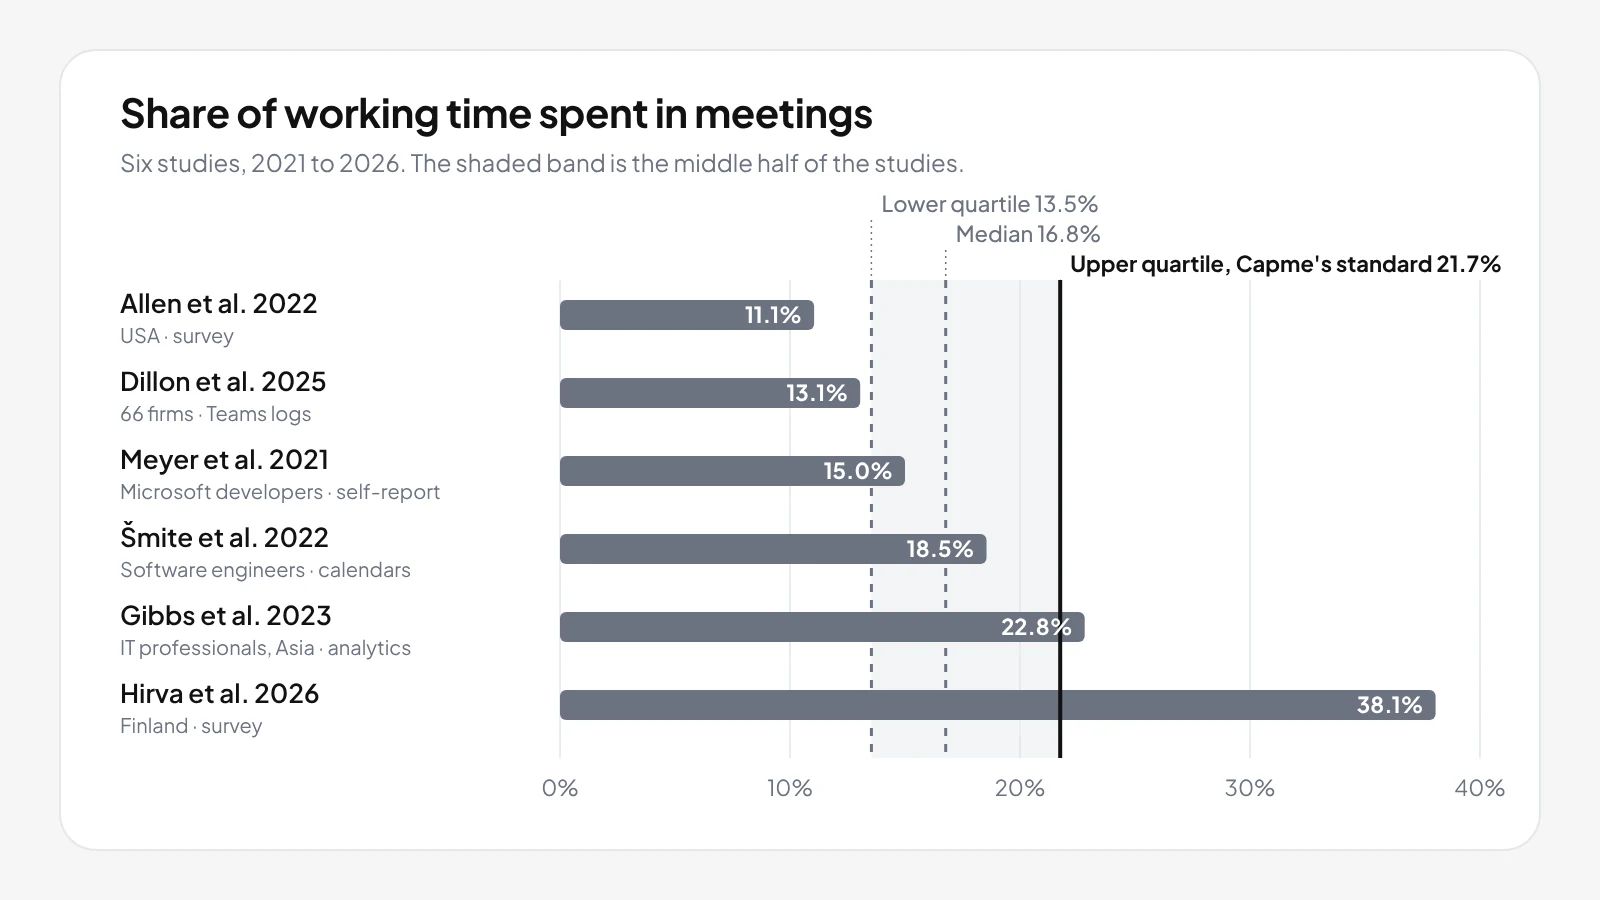
Employees spend between 11% and 38% of their working time in meetings, according to six academic studies published from 2021 to 2026. That share is meeting hours divided by contracted working hours. The middle half of the studies lies between 13.5% and 21.7%, with the median at 16.8%. Capme uses the upper end of that middle half, 21.7%: about 8.7 hours of a 40-hour week, or 1.7 hours a day.
How much time do employees spend in meetings, study by study?
Six studies measured between 11.1% and 38.1%. The table gives each one's sample, method and share.
| Study | Who | Method | Data from | Meeting time | Share |
|---|---|---|---|---|---|
| Allen et al. 2022, J. Occup. Environ. Med. | 195 full-time employees, USA | Survey | April 2020 | 4.42 h a week | 11.1% |
| Dillon et al. 2025, NBER WP 33795 | 7,137 knowledge workers in 66 firms | Microsoft Teams logs | Sept 2023 to Oct 2024 | 5.22 h a week (Teams only) | 13.1% |
| Meyer et al. 2021, IEEE TSE | 5,971 responses from Microsoft developers | Self-report of one workday | Before 2019 | 85 min a day | 15.0% |
| Šmite et al. 2022, J. Syst. Softw. | Software engineers, Sweden, USA, UK | Calendar invitations | 2019 | 89 min a day | 18.5% |
| Gibbs et al. 2023, JPE Micro | Over 10,000 IT professionals, Asia | Workplace analytics | Apr 2019 to Mar 2020 | 10.2 of 44.7 h a week (meetings and calls) | 22.8% |
| Hirva et al. 2026, IJOTB | 1,910 employees, Finland | Survey | Autumn 2024 | About 3 h a day of 39.4 h a week | 38.1% |
| Seventh, kept apart: Deming et al. 2026, NBER WP 35706 | Over 9,000 workers, Norway | Survey linked to register data | Not in the abstract | Not given in hours | 12% |
Method: sorted, the six unrounded shares run 11.1, 13.1, 15.0, 18.5, 22.8, 38.1. Linear interpolation (QUARTILE.INC in a spreadsheet) gives 13.54, 16.77 and 21.75%. The upper quartile is the value a quarter of the studies lie above. The NBER paper (12%) stays out: it appeared after the six were fixed and gives no hours.
Why is the median not halfway between the quartiles?
With six values the median is the midpoint of the third and fourth: (15.0 + 18.5) / 2 = 16.8. Below the median the studies lie close together, above it they spread out: 18.5 to 22.8 is a wider step than 13.1 to 15.0. So the median is 3.2 points above the lower quartile and 5.0 points below the upper one.
Why does Capme use 21.7% and not the median?
Capme uses 21.7% rather than the median because the six samples undercount leads, who sit in far more meetings. Three reasons:
- The samples are mostly developers and employees in general, and managers sit in far more meetings. In MIT Sloan Management Review in 2007, Rogelberg, Scott and Kello put the average employee at "approximately six hours per week in scheduled meetings" and "senior managers" at "nearly 23 hours", about 57.5% of a 40-hour week.
- Method moves the values both ways, which explains most of the spread. The two lowest miss meetings by design: Dillon et al. count only Microsoft Teams, so meetings in a room are missing, and Allen et al. asked in April 2020, in the first weeks of lockdown. The highest is a self-report (Hirva et al.), and Gibbs et al. count calls too. Method widens the range; role is what puts Capme above the median.
- A team of eight with one lead lands about there: seven at the median, 16.8%, and the lead at 57.5% average 21.9%. A team lead sits below Rogelberg's senior managers, so read 21.9% as an upper bound.
For a cautious reader, quote the median, 16.8%.
What does that share cost? Two worked examples
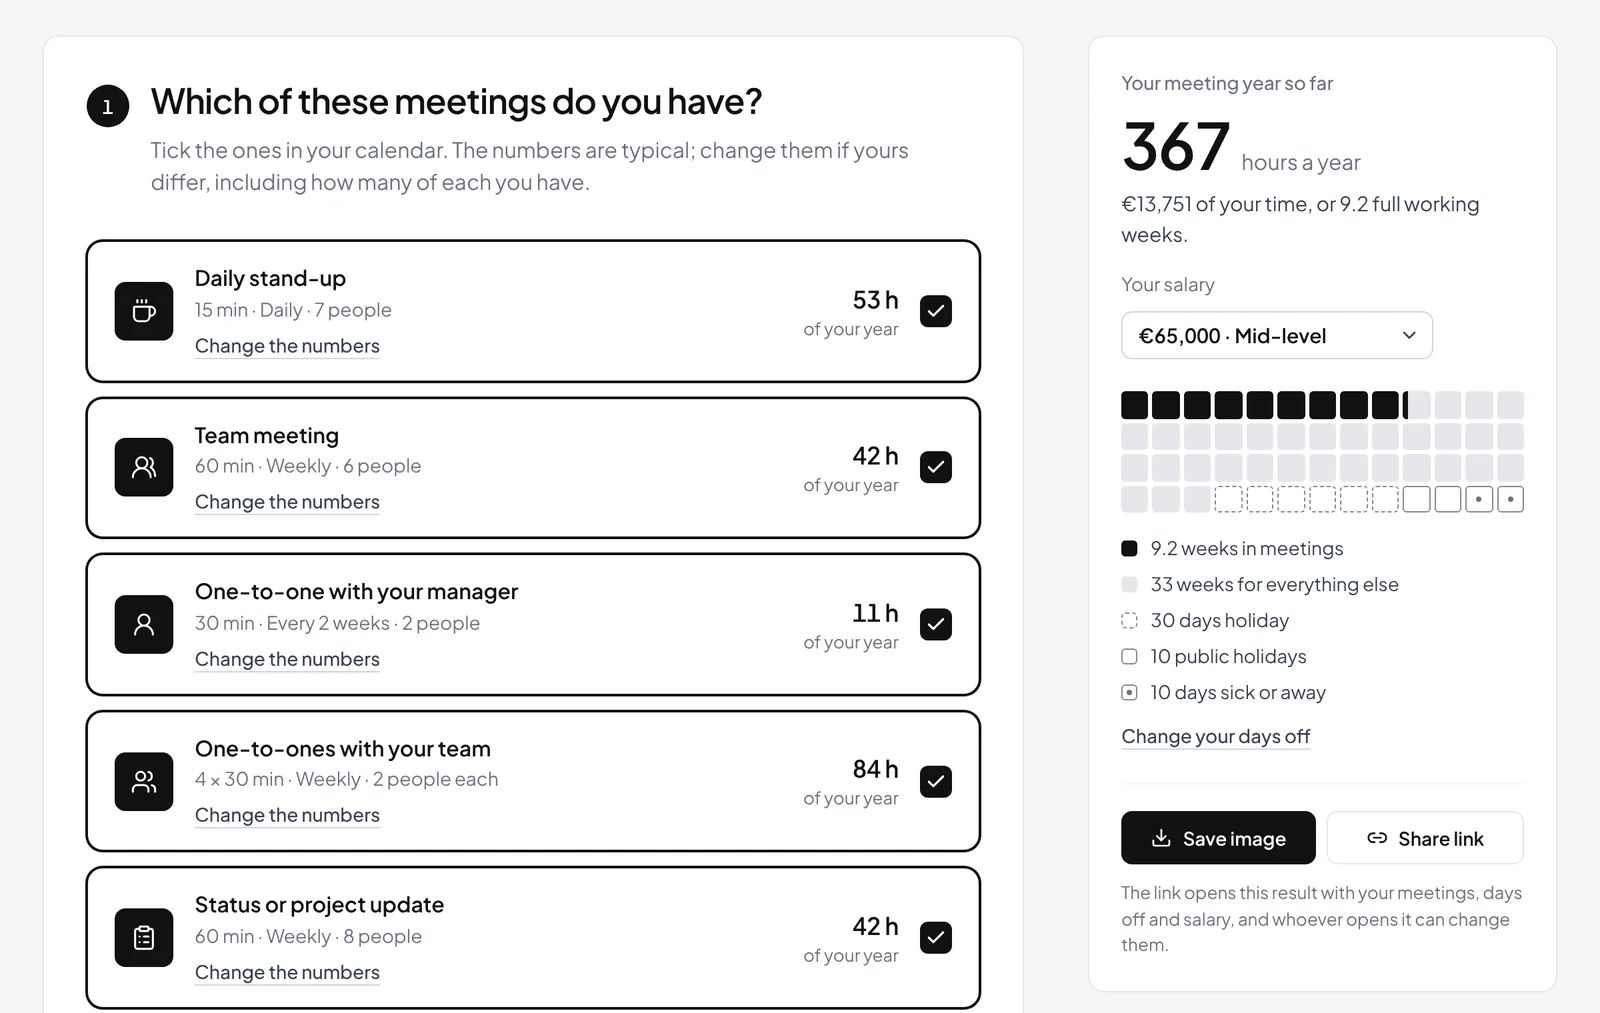
The meeting hours calculator turns one calendar into a year. Its sample team lead spends 367 hours a year in meetings, 9.2 full working weeks of the 42 left after holidays and sick days.
Count your own meeting year
Tick your standing meetings.
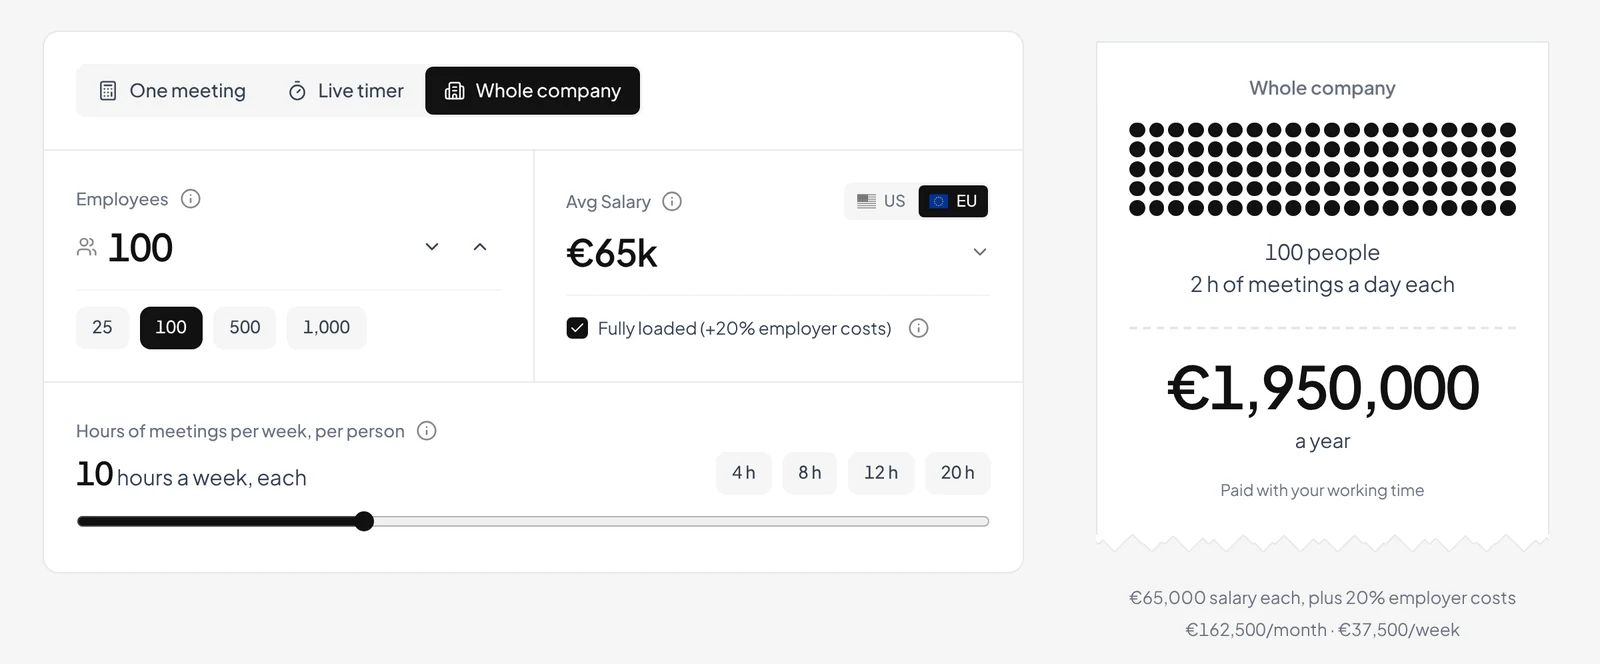
For a whole company, the meeting cost calculator multiplies people, hours and salary. It opens on 100 people at €65,000 a year, €78,000 with employer costs, and 10 hours of meetings a week each: €1.95 million a year. At our standard of 8.7 hours it would be about €1.70 million.
Put your company's numbers in
People, hours and salary; the cost shows as you type.
Both calculators count salary only; how to calculate the cost of a meeting explains what that leaves out.
Where do 85%, 31 hours, 252% and 23 hours come from?
Statistics roundups repeat 85%, 31 hours, 252% and 23 hours, and none measures the meeting share of an ordinary week.
- 85%: Bain wrote in 2010 that "85% of executives are dissatisfied" with their companies' meetings.
- 31 hours a month: an Atlassian infographic from 2012 with 62 meetings a month, half of them seen as wasted, and no named sources (CMSWire, 2012).
- 252%: Microsoft's Work Trend Index of March 2022, the growth in weekly meeting time for the average Teams user since February 2020.
- 23 hours a week: senior managers only (Rogelberg 2007, above), repeated by Harvard Business Review in 2017.
What share of payroll do meetings take? The 2026 NBER study
Meetings take 14% of firms' wage bills and 12% of work hours in Norway, according to the 2026 NBER study by Deming, Løken, Willén and Xu. High-paying firms spend more on meetings, and more meetings go with faster wage growth. It is an unreviewed working paper showing a correlation. Most meeting activity in it is planning, problem solving, information sharing and coordination; a recorded update can take over only the information sharing. More in what the research says about async communication.
Which meeting-time figure should you quote, and for whom?
For a team's business case quote 21.7% with its spread, for a cautious reader the median, for finance the NBER's 12% of hours; each has a weak spot.
| Reader or purpose | Figure to quote | Where it falls short |
|---|---|---|
| Business case for a team | 21.7%, spread 11% to 38% | Six samples, mostly IT and knowledge work |
| A cautious reader | Median 16.8% | Leaves out most of the time leads spend |
| Leadership team | Nearly 23 h a week for senior managers | From 2007, before video calls became routine |
| Case for async updates | None of the six; count your own team | No study here measures time saved by going async |
| Finance, payroll | 12% of hours, 14% of wage bills (NBER 2026) | Norway only; working paper |
What can Capme show about meeting time, and what can it not?
Capme does not measure meeting time: the meeting platform connects to no calendar. It shows whether recorded updates get watched. Take a weekly one-hour status meeting: eight people, four updates. In Capme the organiser turns it into four agenda topics, each with a speaker and a five-minute budget, and one recording deadline. The speakers record in the browser; once the organiser sends the recorded agenda, everyone watches one chapter per topic, about 20 minutes in all, and the organiser sees who watched, partly watched or has not opened it. Discussion and decisions stay in a live call. Capme is not a call tool or a notetaker. On Team, videos are hosted in the EU.
The admin overview shows videos recorded and the share watched over 30 to 365 days; a topic counts as watched at 75%. Team costs €12 per speaker a month, net, from 3 speakers (pricing, November 2026); viewers are free. Capme can be tried for 14 days; the pilot plan shows how to run the trial.
How do you measure your own team's share of time in meetings?
- Send the message after an ordinary week: no holidays, no quarter end.
- Ask five to ten people in one role for their meeting hours that week, with the message below. Each can also drop a calendar export into the meeting hours calculator, which reads it in the browser and does not upload it.
- Divide the summed hours by the contracted hours of the people who reported.
- Compare the result with the quartiles. Below 13.5% is light, 13.5% to 21.7% is the middle range, and above 21.7% the recurring meetings are the first place to look. These ranges fit staff; leads land higher by role, so compare leads with leads.
- Note which recurring meetings only pass information on; which meetings can go async sorts nine meeting types by that test. After changing them, count again with the same people.
In Germany, software that evaluates individual calendars automatically is technical monitoring a works council has a say in under § 87(1) no. 6 BetrVG; see introducing a video tool in Germany. The same applies to Capme's per-person watch progress; an admin can switch it to Totals only. This is not legal advice.
Frequently asked questions
- Is 21.7% the average time spent in meetings?
- No. 21.7% is the upper quartile of six studies that range from 11% to 38%. Their median is 16.8% and their mean 19.8%. One Finnish self-report pulls the mean up.
- How much time is wasted in meetings?
- Only surveys ask that, and the answers are opinions. In the HR WORKS survey of February 2025, employees in Germany judged 3.2 of their 4.7 weekly meeting hours wasted. In the 2022 survey for Otter.ai, workers said they could have skipped almost 6 of 18 hours.
- How much time do employees in Germany spend in meetings?
- None of the six studies is German. A February 2025 vendor survey of 1,040 employees for HR WORKS found 4.7 self-reported hours a week, about 12% of 40 hours.